Key Features of Flourish
Key Features of Flourish
Flourish provides an intuitive and powerful environment for data-driven storytelling. Here are its most significant features:
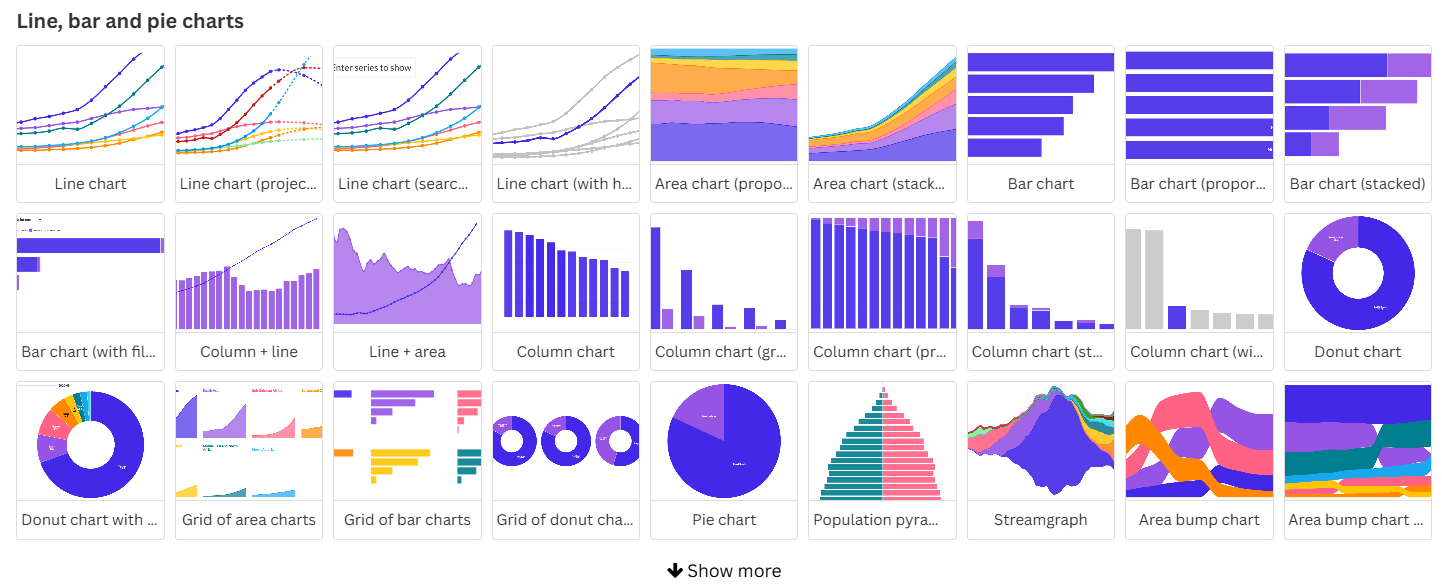
1. Wide Range of Visualization Templates
Flourish offers pre-built interactive templates for various chart types, including:
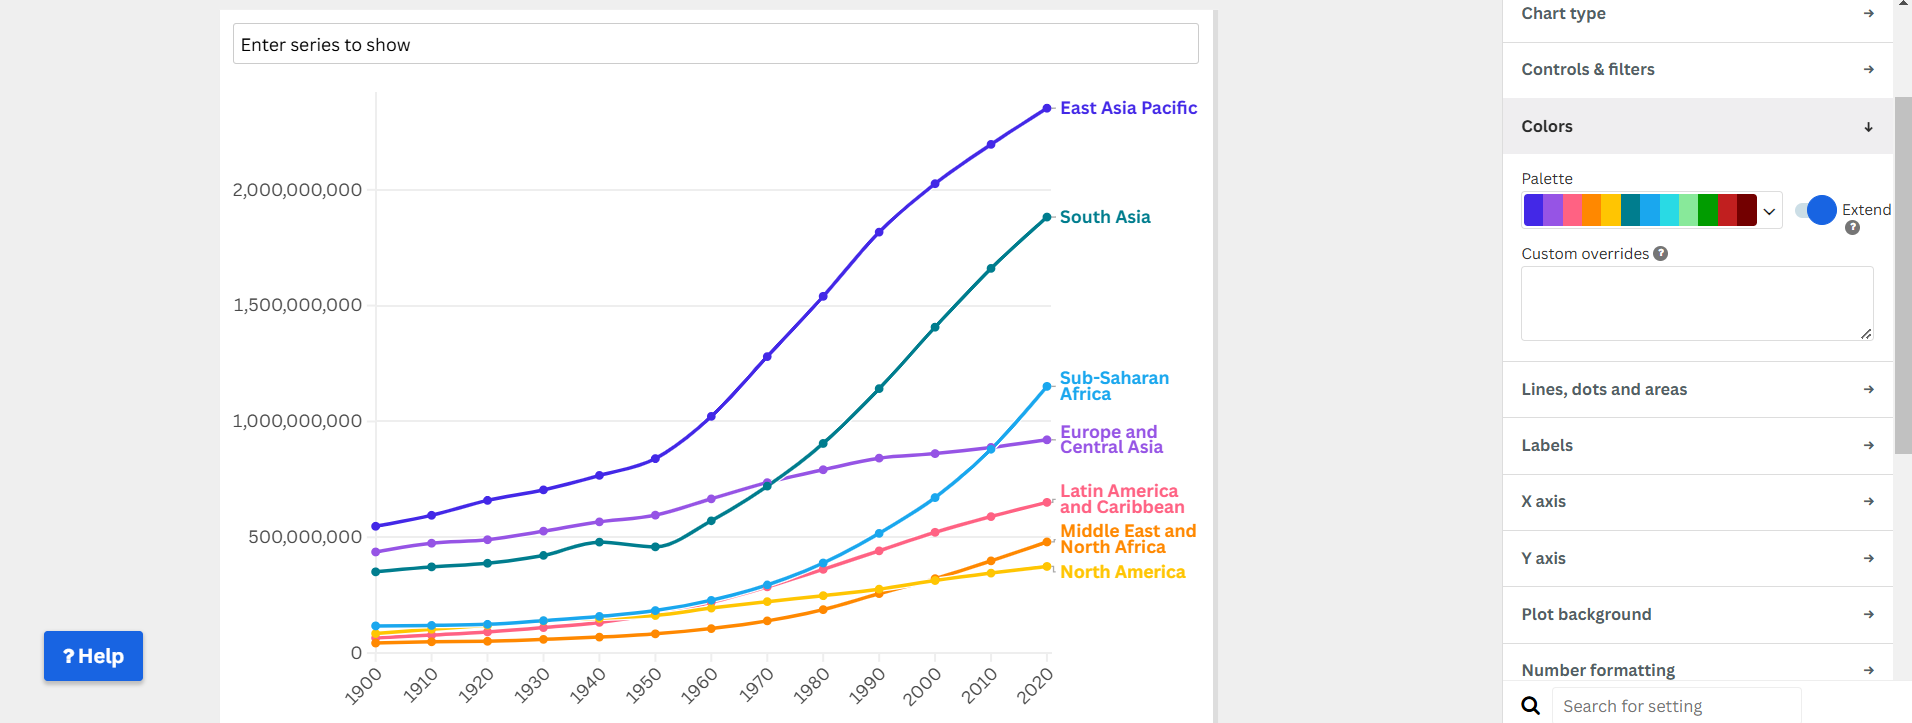
- Bar charts, line charts, and scatter plots for statistical analysis.
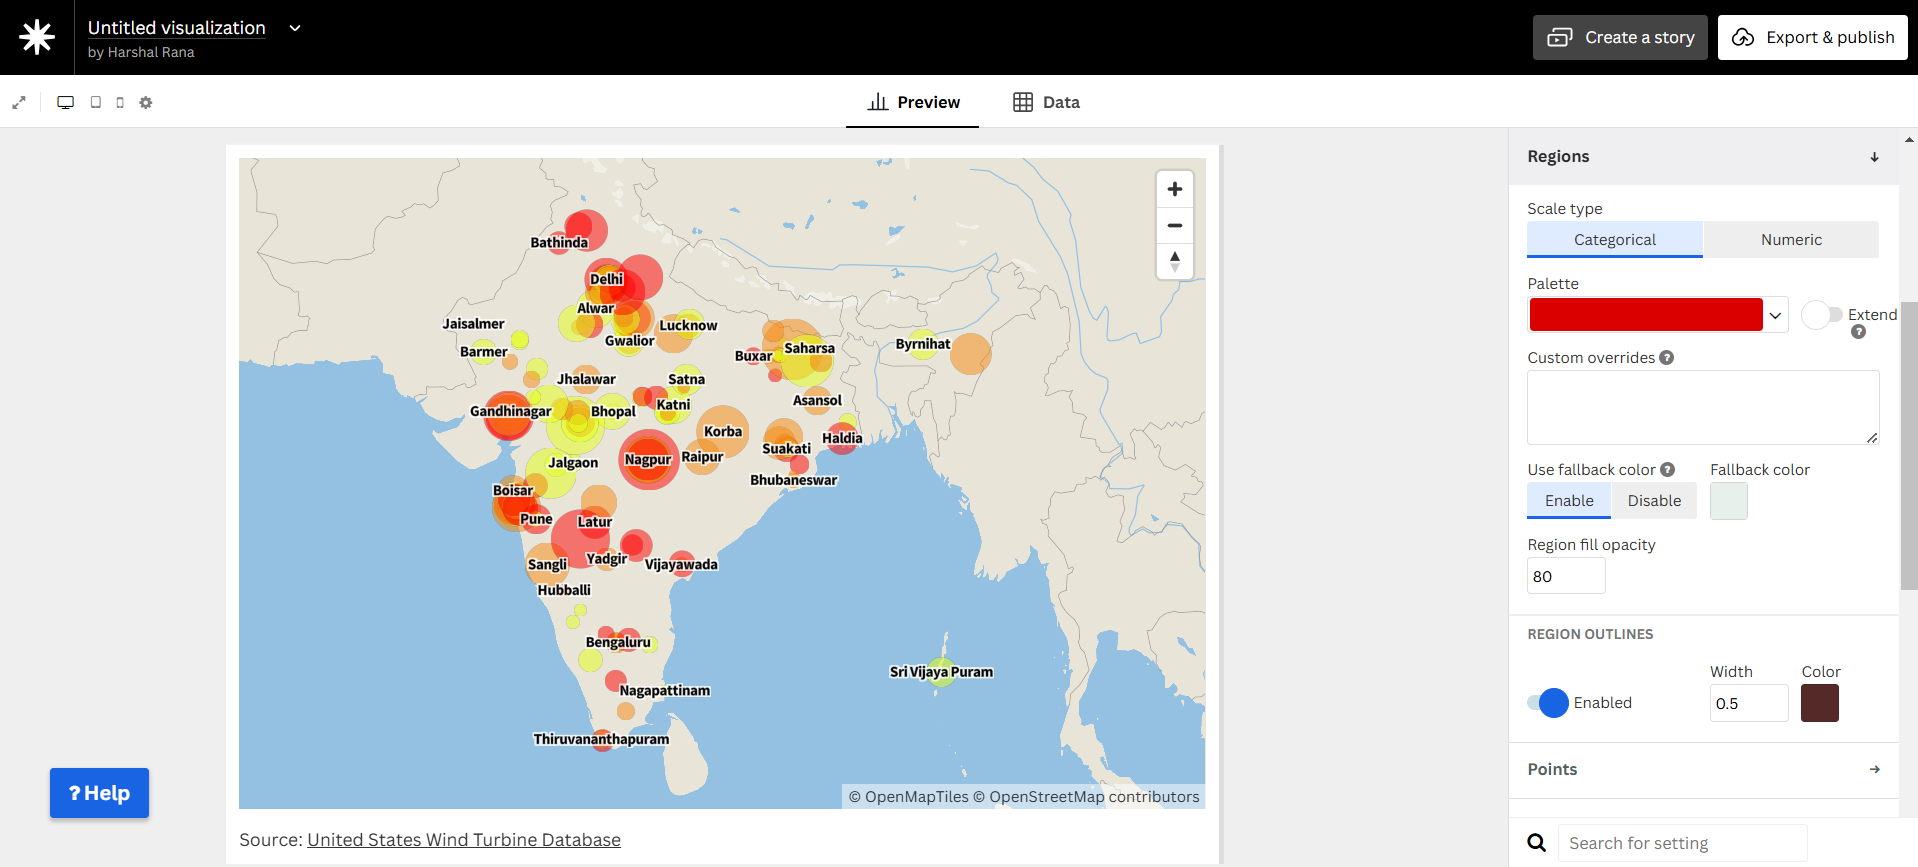
- Choropleth maps and point maps for geospatial visualizations.
- Animated race charts for dynamic data representation.
- Network graphs and hierarchy visualizations for complex relationships.
2. No Coding Required
Unlike traditional visualization tools that require JavaScript (like D3.js), Flourish allows users to:
- Upload structured data (CSV, Excel, Google Sheets).
- Map columns to chart elements without writing any code.
- Generate compelling visuals in just a few clicks.
3. Data-Driven Storytelling
One of Flourish’s most powerful features is its ability to create narrative-driven visualizations. Users can:
- Create multi-slide stories that animate changes in data over time.
- Use interactive filters and buttons to enhance engagement.
- Combine multiple visualizations into a seamless report.
4. Customization & Branding
Flourish allows extensive customization:
- Modify colors, labels, and fonts to match brand identity.
- Add custom tooltips and interactive elements.
- Use advanced styling options for a professional look.
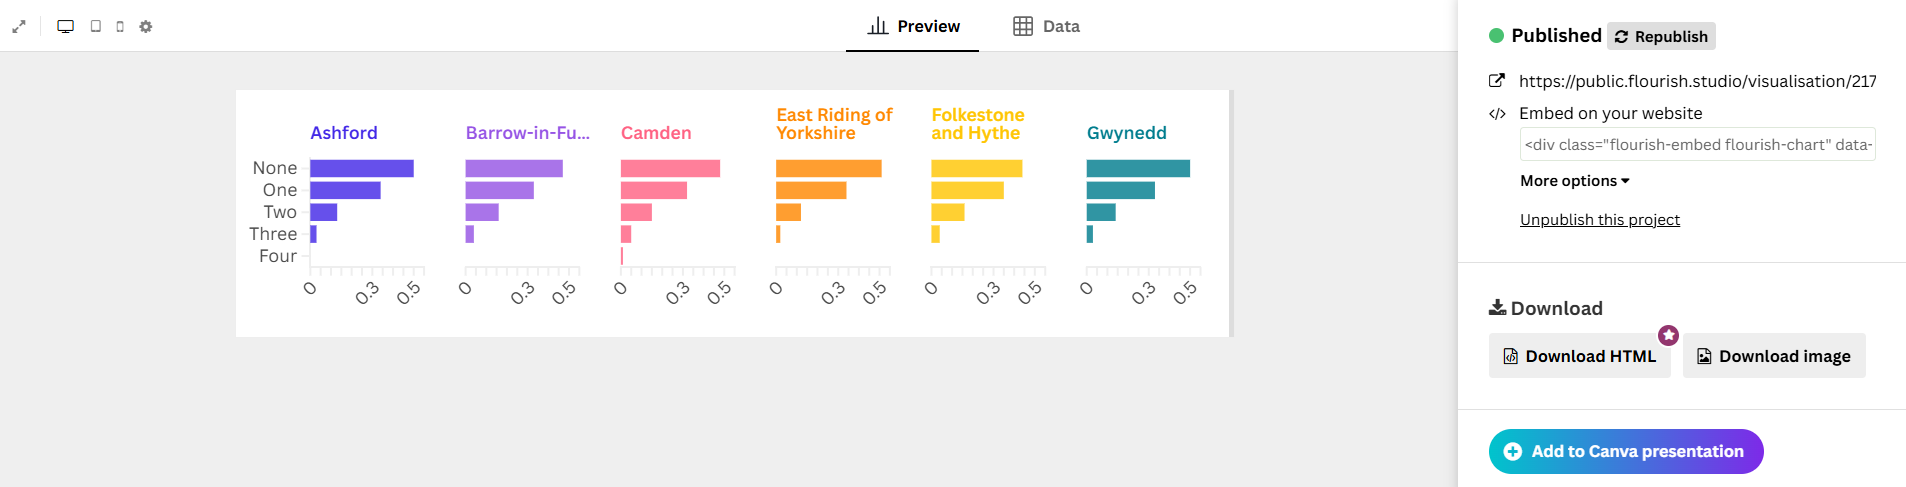
5. Embedding & Sharing
Flourish makes it easy to share visualizations:
- Export as high-quality images or PDFs for reports.
- Generate embed codes for websites and blogs.
- Integrate with third-party platforms like WordPress or Google Data Studio.
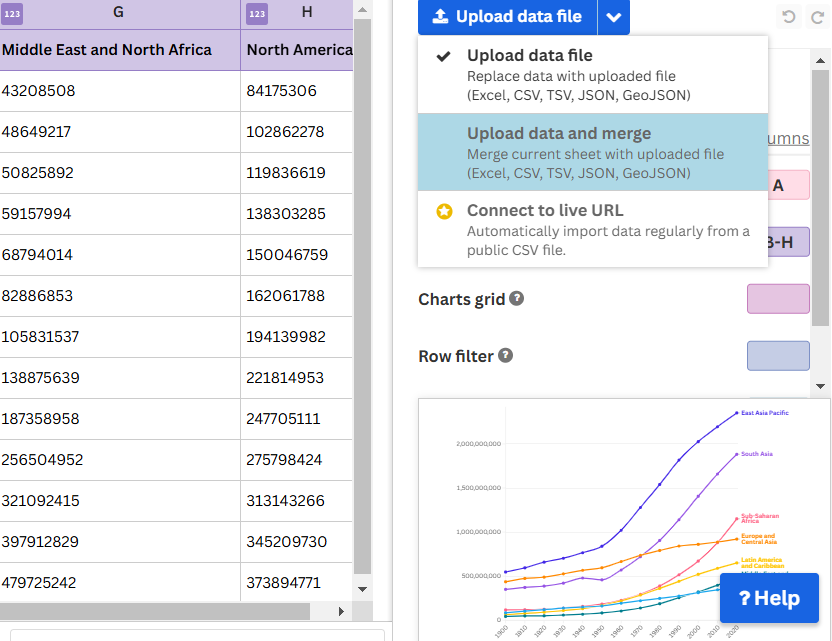
6. Real-Time Data Integration
Flourish supports live data connections, meaning you can:
- Link Google Sheets or CSV URLs for real-time updates.
- Automatically refresh visualizations without re-uploading data.
- Stream data from APIs (available in the Pro version).
Flourish is a powerful yet simple tool that democratizes data visualization. Whether you’re a journalist, researcher, student, or business analyst, it enables you to present data in an engaging and interactive way.